

Europe took 40% of H1 Chinese solar module exports at 50.5 GW, down 7% YoY, with Greece showing strong growth
Africa saw 45% YoY growth; Pakistan, Saudi Arabia, and South Africa led respective regional demand
Export tax rebate reduction and China’s market-based pricing may increase prices, impacting demand
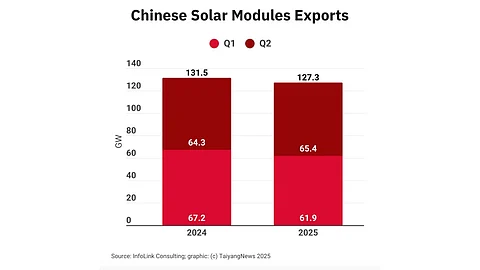
InfoLink Consulting says Chinese solar PV manufacturers exported 3% less solar PV module capacity on a year-over-year (YoY) basis in H1 2025, totaling 127.3 GW versus 131.9 GW they collectively shipped during the same period in 2024.
This includes close to 21.7 GW exported within the month of June during the reporting period. It represents a 3% month-on-month (MoM) decrease and a 2% YoY decline compared to 22.1 GW in June 2024.
The Netherlands, Saudi Arabia, Pakistan, the UAE, and Greece were the top destinations during the reporting month, as these accounted for close to 34% of the global market for Chinese manufacturers.
InfoLink’s statistics are based on data from the Chinese customs. In Q1 2025, the total exports were 61.9 GW, which means Chinese suppliers exported 65.4 GW in Q2 (see Chinese Solar Module Exports Decline By 8% YoY in Q1 2025).
According to the analysts, Chinese companies are exploring emerging markets for their exports as traditional markets saturate. This includes smaller countries in Southeast Asia and Africa, with solar project development in Africa steadily taking off.
However, Europe accounted for approximately 40% of the China solar module exports volume during H1 2025, or around 50.5 GW, a 7% decrease from 54.2 GW a year ago.
In June 2025, Chinese exports to Europe increased by 4% YoY to 9.7 GW. The market intelligence firm points out that apart from the Netherlands that accounted for 34% or around 3.3 GW, it was Greece that was the 2nd largest European market, with 9% of total European imports, or 900 MW, 219% more than 280 MW in June 2024.
During the initial 6 months of this year, the Netherlands continued to be the leading European export market for Chinese suppliers, followed by Spain and France that imported 4.35 GW and 4.3 GW, respectively.
There was a slight increase of 5% YoY in Chinese solar module exports to the Asia Pacific market that imported nearly 42.5 GW during H1, up from 40.5 GW. Of this, Pakistan accounted for 13.4 GW of modules. While India’s shipments continued to decline since April, which the analysts attribute to China’s 5M 2025 solar installation rush, it was still the 2nd largest country in the region with imports of 8.4 GW.
Pakistan was the largest market in the region in June, importing close to 1.14 GW, or 21% of the total capacity. It was, however, 41% less than the 1.93 GW reported for the same period in 2024. The Philippines followed next with 830 MW, or 15% of the total.
The Americas bought around 14.15 GW of solar modules, a 16% decrease on a YoY basis during H1, with 6.84 GW landing in Brazil. For June, Chinese exports totaled around 2.03 GW, representing a 5% MoM increase but a 30% YoY decrease. Brazil was the largest region during the reporting month with 850 MW, or 42% of total shipments, indicating a 57% decrease compared to June 2024.
China’s solar module exports of 3.05 GW to the Middle East were up 18% sequentially in June, and 9% YoY, led by Saudi Arabia’s 1.2 GW. Even though it represented 39% of the total module imports in the region, it was 30% less than last year. The UAE followed with 910 MW or 30% of the total.
For H1 2025, out of the 12.91 GW shipped to the Middle East, Chinese manufacturers suffered a 17% decline on a YoY basis, led by Saudi Arabia’s 4.95 GW.
Africa imported 7.27 GW from Chinese manufacturers, a 45% annual jump, including 1.65 GW to South Africa – the largest market in the region.
For June, shipments included 1.47 GW with a 5% MoM and a 34% YoY increase. South Africa imported approximately 310 MW or 21% of the total. Sudan, with 190 MW of imports, represented 14% of the market and a 4,023% annual increase. Egypt was next with 180 MW or 12%.
Going forward, the analysts list adjustments to China’s export tax rebates, which were lowered from 13% to 9% since December 1, 2024, as the government sought to curb excess production and overcapacity (see China To Lower Solar Export Tax Rebates From 13% To 9%).
Additionally, InfoLink expects a slight increase in solar module prices in light of China’s shift to the market-oriented pricing system since June 1, 2025. It also forecasts low inventory levels in some overseas markets. In Q3 2025, the manufacturers may replenish inventory with advance purchases, added the analysts.
