

US utility-scale solar PV deployment surged 56% in 2024 to 35 GW DC/30 GW AC, the country’s highest annual addition, says LBNL
Texas led with 7.7 GW AC new capacity; the report highlights regional concentration and uneven growth
Project costs rose slightly to $1.61/W AC, and LCOE increased to $60/MWh (sans tax credits) due to higher financing and construction expenses
Utility-scale solar PV deployment in the US in 2024 increased by 56% annually to 35 GW DC/30 GW AC. These facilities with a nameplate capacity of over 5 MW AC accounted for 54% of all new grid-connected capacity, says Lawrence Berkeley National Laboratory (LBNL) in its new U.S. Utility-Scale Solar 2025 Data Update.
This beats record additions of 23.9 GW DC/18.5 GW AC the lab reported for 2023 (see US Installed 18.5 GW AC Utility-Scale Solar PV Capacity In 2023).
Utility-scale solar accounted for 54% of the new power generation capacity additions in the country, while distributed solar’s share was 13%. Together, solar accounted for a combined 67% of all capacity added to the US grid last year, as per the report. Most of the capacity was added in H2 2024.
Texas was, once again, the state with the largest chunk of new capacity additions last year, totaling 7.7 GW AC, followed by Florida with 3.2 GW AC, California with 2.5 GW AC, Illinois with 1.6 GW AC, and Ohio with 1.5 GW AC.
With the addition of 7.6 GW AC in 2024, the Electric Reliability Council of Texas (ERCOT) region leads cumulative capacity with 23 GW AC, showing the uneven distribution of installations in the country, point out the analysts.
Overall, 99% of new utility-scale projects featured single-axis tracking as the upfront cost premium for trackers has been steadily coming down, leading to favorable overall economics.
The average size of new solar projects also increased to 120 MW AC, 40% larger than in 2023. Project costs are decreasing, as larger project sizes of more than 250 MW AC cost $1.38/W AC compared to smaller projects of 20 MW AC costing $2.19/W AC. This shows the price benefits of economies of scale.
In terms of technology, c-Si modules expanded their market share to 79% of newly installed capacity in 2024. Thin film modules have a lower market share, but reported a new annual deployment record capacity of 6 GW AC.
Utility-Scale Solar PV Costs
Costs increased 1% year-on-year (YoY) during the reporting year, according to the analysis, as the average installation cost of projects reached $1.2/W DC / $1.61/W AC. Yet, there has been a decline of 73% between 2010 and 2022. However, costs do vary from region to region and grid to grid, and are also driven by land availability, prevailing labor rates, and transmission network upgrade costs, according to the report.
Higher financing costs, increased construction expenses, and slightly lower-than-estimated performance increased the levelized cost of solar energy (LCOE) in the country from $53/MWh to $60/MWh between 2023 and 2024 (without tax credits). Even after including tax credits and bonuses – namely Investment Tax Credit (ITC), Production Tax Credit (PTC), and energy community bonus – costs still rose from $36 to $41/MWh.
Projects completed in 2024 had an average PPA price of $29/MWh, up 14% from 2023, according to LBNL. It also noted that new PPAs signed in 2024 are becoming more expensive, even exceeding the decline in wholesale market value in some regions.
Solar and Battery Hybrids
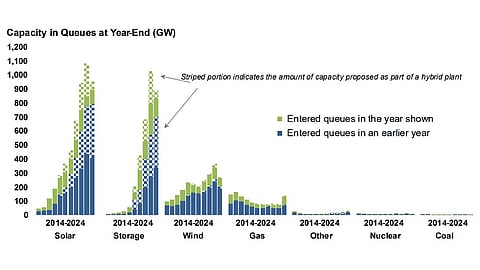
In 2024, the US added 7.4 GW of new PV and 4.3 GW of storage from 33 new hybrid solar-plus-battery projects. The share of such hybrids is rising – of the 956 GW of utility-scale solar capacity in interconnection queues last year, 452 GW (47%) were solar and battery hybrids, especially in regions like CAISO and ISO West. However, the total queued capacity declined 12% year-over-year.
Berkeley Lab reports that 161 GW of new solar capacity entered the queue in 2024, though CAISO and PJM paused new applications. Going by historical trends, only about 9% of queued solar projects will ultimately get built.
Solar (standalone and hybrid) remains the largest resource in these queues, followed by storage, while wind and gas rank 3rd and 4th. Other resources are minimal.
The complete report is available for free download on LBNL’s website.
