

The >22.5% efficiency band expanded steadily from 16% at the start of 2024 to 47% by December 2025, becoming the most represented category as more products crossed the 22.5% threshold
The >22.0%–22.5% and >21.7%–22.0% bands declined over time, largely due to products transitioning into higher-efficiency categories rather than widespread delistings
The 21.5%–21.7% band, dominated by PERC modules, saw a sustained reduction in product count and share, reflecting ongoing delistings as manufacturers phased out PERC products
The number of products in TOP SOLAR MODULES has been declining; however, it remains relatively high at 45 by the end of 2025, making a single, consolidated presentation difficult. For clearer analysis and easier interpretation of the data, the products are therefore grouped into 4 efficiency bands: above 22.5%, 22.0%-22.5%, 21.7%-22.0%, and 21.5%-21.7%.
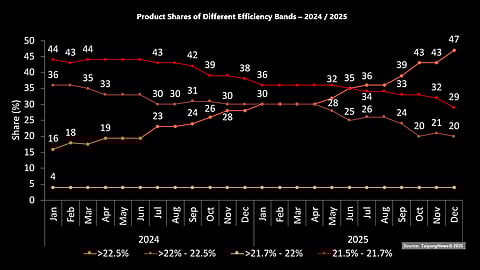
Starting off with numerical data, the graph above provides a 2-year overview of the efficiency development of the different products listed in TOP SOLAR MODULES, categorized into the 4 efficiency bands.
As shown in the graph, there is a general upward trend in products in higher-efficiency bands. The number of modules in the >22.5% efficiency category, which is the highest, has increased consistently. The band’s share in the overall TOP SOLAR MODULES has risen from 16% at the beginning of 2024 to 47% by the end of 2025, completely reversing from the least representation to the highest in 2 years. The shares of 2 out of the remaining 3 bands – >22%-22.5% and >21.7-22% – have declined consistently during this period. While the former declined from 36% to 20%, the latter fell from 44% to 29%. The 21.7%-22.0% band remained marginal throughout, contributing only a small share of 6%, which remained unchanged.
Starting with the highest efficiency band of >22.5%, during H2 2025, the number of products in this efficiency band remained at 18 until August, while its share increased to 36% in July from 35% in June. In September, 2 additional products entered this band, increasing the count to 20 and the share to 39%. The upward trend continued in October, when one more product was added, and the share increased to 43%. Another notable change occurred in November, when one product was delisted from the high-efficiency category. However, the reduction in product count did not affect the overall share of this band. By December, the band reached its highest share of 47%, represented by 21 products, making it the efficiency category with the highest representation.
The band also expanded its share in H1 2025, from 30% in January to 35% by June. In January, although the number of products in this band remained at 15, the overall decline in the total number of listed modules increased the band’s share. The count stayed stable till April and increased to 16 in May, when one more company entered this high-efficiency category. In June, there were 2 additions. Accounting for 18 products out of a total of 51, June marked the first time the >22.5% efficiency band achieved its largest representation to that point, at 35%, alongside the lowest efficiency range of 21.5%-21.7%.
This upward movement follows a year of gradual growth in 2024, in which the band started at 16% in January, increased to 26% by October, and reached 28% by December. The gains were supported by more manufacturers commercializing modules above the 22.5% threshold, mainly based on BC and TOPCon cell architectures.
Interestingly, the development progress in the next band – >22%-22.5% – is in contrast to the one above. Its share decline is not primarily driven by product delistings, but rather by products transitioning to the higher efficiency range. This is the band where products from many companies started with high-efficiency technologies such as HJT and TOPCon. But as they gained expertise, companies eventually improved the efficiency of these products and began commercializing modules with much higher efficiencies, a few even beyond 22.5%.
During H2 2025, the share of this band gradually declined to 20%. The second half of the year began with 13 products, which accounted for a 26% share in July, a 1% increase over June, and remained unchanged in August. In September, the efficiency improvement in 1 product led to a further decline in the share of this band to 24%. In October, a combination of 1 product moving to a higher-efficiency band and another being delisted caused the share to fall to 20%. Another significant change occurred in December, when an additional product transitioned to a higher-efficiency band, reducing the product count in this category to 9 and leaving the share at 20%.
In H1 2025, the share of this band was consistent at 30% for the first 4 months. In May, one product moved to the higher band, reducing the share of this band to 28%. Then, in June, another company improved beyond the 22.5% level, which led to a decrease in the band’s share to 25%.
The band also followed a downward trend throughout 2024, from 36% in January to 30% by December 2024.
The >21.7%-22% efficiency band has consistently had the lowest representation across the analysis period. From the beginning of 2024 to the end of 2025, the number of products in this efficiency range remained consistently at 2, corresponding to a 4% share. This category continued to represent a small group of modules that were either early versions of higher-efficiency designs and/or products not further developed.
The 21.5%-21.7% efficiency band is almost exclusively represented by PERC products, especially since 2024. During H2 2025, this band continued to contract, extending the declining trend already observed in H1 2025. Entering H2 2025, in July, one product was delisted, reducing the share to 34% from 35% in June, and it remained the same also in August with a product count of 17. In September, despite no further delistings within this band, its share declined to 33% due to an increase in the overall number of listed products. In October, while the share remained unchanged, despite the delisting of another product from this efficiency range. In November, one more product was removed, reducing the product count to 15 and the share to 32%. In December, another 2 products were delisted, bringing the total to 13 and reducing the share to 29% by the end of 2025.
In H1 2025, the share of modules in the band declined slightly from 36% in January to 35% in June, with no changes in product count from 18 during this period. That being the case, it remained one of the most populous bands, reflecting the residual presence of PERC modules in the market.
Throughout 2024, this band showed a clear downward trend. It started the year with a 44% share in January, plateaued at that level during the first half, and then declined to 38% by December. The decline in the latter part of the year was due to the delisting of 5 products, as the respective companies ceased PERC production and removed the products from the market. With no new companies entering this band, its fall accelerated.
Complementing this efficiency-based assessment, TaiyangNews also recognizes sustained leadership through its TOP SOLAR MODULES Badge of Excellence, awarded to manufacturers that feature in the top 10 rankings for at least 6 months in a calendar year (see TOP SOLAR MODULES 2025: Badge Of Excellence).
The text is an edited excerpt from TaiyangNews’ latest TOP SOLAR MODULES Report 2025, which can be downloaded for free here.
TaiyangNews is bringing together the Indian solar PV manufacturing industry for the Solar Technology Conference India 2026 (STC.I 2026). To be held on February 5 and 6 in Aerocity, New Delhi, this 2nd edition of the TaiyangNews physical conference will also have banks, investors, and policymakers in attendance. Register for the event here.
