

TOPCon remained the dominant technology throughout 2024 and 2025, with its share increasing from 40% in July 2025 to 44% by December 2025
PERC recorded the strongest contraction, with its share declining from 34% in July 2025 to 29% by December 2025
HJT’s product count remained unchanged during H2 2025, while its share increased from 18% in July to 20% by December
BC remained the least represented technology, with product count declining from 4 to 3 in November 2025 and its share fluctuating between 6% and 8% over the period
Analyzing efficiency progress by cell technology adds another layer of insight. While efficiency band trends provide a broader picture – since each cell technology generally falls within a specific range – there are always exceptions, and the finer details can also be revealing. The TaiyangNews TOP SOLAR MODULES Report takes a more in-depth look at the progress of each cell technology.
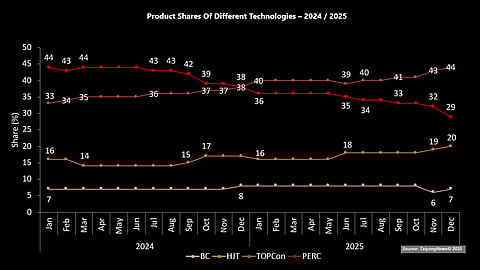
Share of Technologies
Starting with the most recent data, changes in technology shares in H2 2025 were driven primarily by variations in the overall number of listed products, rather than by additions within individual technology categories.
TOPCon remained the dominant technology throughout the second half of 2025. The number of TOPCon products increased modestly from 20 in July to 21 in September, then returned to 20 the next month and remained at this level until year-end. Despite this limited net change in product count, TOPCon’s share increased from 40% in July to 44% by December, primarily enabled by the continued contraction of the overall listing and the accelerated delisting of PERC products. At the beginning of the year, TOPCon marginally overtook PERC in terms of share, rising to 40% from 38% the previous month. It maintained this lead, though dipping slightly to 39% by June 2025. In fact, TOPCon benefited from PERC’s decline, which dropped by the same 2% in January compared to December 2024.
HJT showed no change in the absolute product count during H2 2025, remaining at 9, while the product share did increase. Starting at 18% in July, the technology representation increased to 19% in November and 20% by December. The increase in share during this period was solely a relative effect, reflecting reductions in other technology segments. During the first half of the year, the only technology stream that moved upward was HJT, which gained a new member in June 2025. This pushed HJT’s share from 16% in January to 18% by mid-year.
BC technology remains the least represented category. The product count remained unchanged at 4 from July through October, then declined to 3 in November and December following a delisting. Consequently, BC’s share remained broadly flat at around 8%, slipping to 6% in October due to the delisting of a BC product, then rising to 7% in December due to the reduced overall product count. During the first half of the year, its share remained unchanged at 8%.
PERC experienced the most pronounced contraction in H2 2025. The number of PERC products declined from 17 in July to 13 by December, following multiple delistings. Correspondingly, PERC’s share fell from 34% in July to 29% at the end of the year. This continued decline reinforced the longer-term trend of manufacturers phasing out legacy PERC products in favor of higher-efficiency technologies. At the beginning of the year, however, it was not strong. As mentioned above, in January, PERC’s share dropped by 2%, while its product count fell by 2 from December 2024 and remained unchanged for the first 5 months. The share then slipped to 35% in June, with a product being delisted.
In 2024, TOPCon was the only technology to show steady growth. It started the year at 33% and ended at 38%, reflecting rising commercial adoption. HJT’s share hovered between 14% and 17% over the year, closing the year at the upper end. BC saw no significant change, consistently represented by 4 products throughout the year and a share of 7% for most of the year, except for a brief increase to 8% in December. PERC, as emphasized above, continued its decline, with its share dropping from 44% in January to 36% by year-end.
Overall, the trends continue to underscore TOPCon’s rise, the steady position of HJT and BC, and the gradual phaseout of PERC as the industry shifts toward higher-efficiency architectures. With all technologies combined, the graph may appear complex. To improve clarity and insight, the following sub-chapters break down the data by individual cell technology.
The text is an edited excerpt from TaiyangNews’ latest TOP SOLAR MODULES Report 2025, which can be downloaded for free here.
TaiyangNews is bringing together the Indian solar PV manufacturing industry for the Solar Technology Conference India 2026 (STC.I 2026). To be held on February 5 and 6 in Aerocity, New Delhi, this 2nd edition of the TaiyangNews physical conference will also have banks, investors, and policymakers in attendance. Register for the event here.
