
Researchers in Poland developed a one-day-ahead PV power forecasting approach using cloudiness indicators derived directly from PV generation data
The approach combines overall and variable cloudiness indices into an angular cloudiness index, which is classified into three weather categories and aggregated into a daily qACId feature
Adding qACId improved forecasting results in 45 of 54 comparisons, with a greater impact on simpler machine learning models than on more complex architectures
Researchers at Wroclaw University of Science and Technology, Poland, have developed a one-day-ahead photovoltaic (PV) power forecasting method that uses weather-related information derived directly from PV generation data. The approach uses an angular cloudiness index (ACI), which can be incorporated into machine learning models without requiring external weather forecasting or meteorological measurements.
The method is based on an observation that cloud cover affects both overall power output and the short-term fluctuations in PV generation. The team combined two features into the overall cloudiness index (OCI). It is calculated by comparing actual PV production, derived from average production data, with expected PV generation. A lower OCI indicates lower output than expected, which can be associated with cloud cover. The second is the variable cloudiness index (VCI), which captures changes in cloud cover by analyzing short-term fluctuations in the PV power output profile.
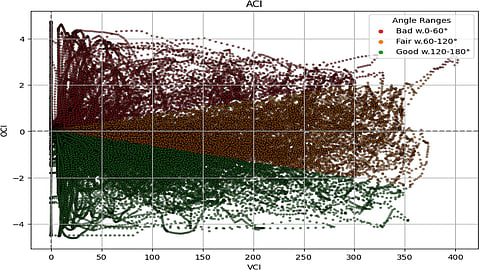
The ACI combines these two indices into a single weather-representing signal. However, the researchers do not directly use this index in the forecasting models. Instead, they divided it into discrete angular sections to get a quantized ACI (qACI). These values are aggregated over the solar day to obtain a daily qACI (qACId).
To convert the ACI into discrete weather categories, the researchers divided its angular range of 0° to 180° into three sections: bad (0°-60°), fair (60°-120°), and Good (120°-180°). The angle is determined by the relationship between OCI and VCI, with the data point’s position relative to the OCI axis defining whether the resulting angle is acute or obtuse.
The team evaluated qACID using data from three installations in Poland, with capacities of 8.865, 9.9, and 25 kWp. The data comes from several years of operations, with generated power recorded in 5-minute intervals. They used six machine learning algorithms and trained and evaluated 1,260 model configurations, comparing those incorporating qACId with reference models that did not use the feature. They assessed forecast performance using Mean Absolute Error (MAE), Mean Squared Error (MSE), and Maximum Error (ME).
The qACId-featured models showed better results in 45 of 54 comparisons, which represented 83% of test cases. The feature had a greater impact on simpler models, such as Polynomial Regression and Random Forest, than on more complex architectures. The researchers suggest that models such as CNN can already extract similar weather-related information from historical power data. In one comparison involving the PV 1 dataset, a simpler regression model achieved comparable or better prediction quality while being 67 times faster to fit and 45 times faster to predict than the CNN model.
The study, titled One-day-ahead photovoltaic power prediction based on local weather properties analysis, is published in Scientific Reports.
