

Analysis of 373 GW DC of US solar assets by Raptor Maps found that average power loss reached 5.08% in 2025, slightly better than 5.51% in 2024, but still much higher than about 5 years ago
The shift to solar trackers and more advanced components, along with rapid expansion in global manufacturing, has increased module non-conformance rates to 3.36% in 2025, the highest in a decade
US installed solar capacity grew 286% in 5 years, while solar jobs increased only 12%, creating significant gaps between technicians and the capacity they are responsible for
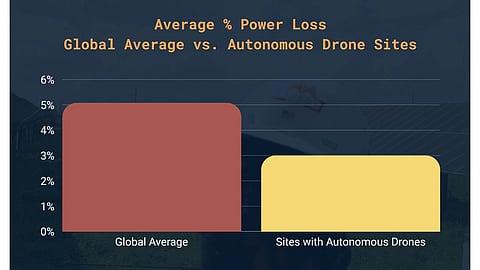
Solar assets using docked autonomous drones recorded an average power loss of around 3%, significantly lower than the dataset-wide average of 5.08%
Asset operators find high-frequency robotic inspections helpful in reducing power losses and improving operational efficiency
The global solar industry is expanding quickly, becoming more technologically advanced, such as higher cell efficiency, but operational losses continue to pose a challenge. The industry is starting to address this with robotics, according to the 2026 Global Solar Report by Raptor Maps.
Data from the report, spanning 373 GW DC US solar assets, shows average power loss reached 5.08% in 2025, a marginal improvement from the previous year’s 5.51% yet significantly higher than levels seen about 5 years ago. On the other hand, solar sites equipped with docked drone technology recorded average power losses of just 3%, compared to the dataset-wide average of 5.08%.
According to this report, rapid global solar capacity growth is accompanied by persistent operational challenges, with many US solar plants still underperforming their expected output.
Among the reasons it cites for this continued underperformance is equipment-driven power loss. Raptor Maps attributes this trend to several factors. One is greater mechanical complexity in modern solar plants; for instance, a shift from fixed-tilt systems to solar trackers. This increases energy generation but also introduces more components, such as motors, sensors, and controllers, that can fail or require maintenance.
The report also points to manufacturing quality challenges linked to the rapid expansion of global production. As new factories and newer cell technologies enter mass production, module non-conformance rates reached a decade-high of 3.36% in 2025, contributing to higher power losses across solar assets, highlights the report.
Another industry bottleneck is a limited labor supply that lags behind capacity. According to the report, the installed solar capacity in the US rose by 286% over the last 5 years, but solar jobs grew only 12%. This means that the country’s solar technicians are responsible for 70% more MW than they were in 2019.
Extreme weather plays spoilsport, too. Raptor Maps reports that over 99% of solar farms in the US are located in areas with 10% chance of hail bigger than 2 inches in close proximity, leading to underperforming assets.
This echoes the findings of kWh Analytics that listed hail as one of the most severe financial threats to solar power investments in a 2025 report (see Hail Costliest Weather Risk For Solar Power Projects).
“One of the trends that stood out this year was that the prevalence of issues on solar farms went up in 2025 for sites of almost all sizes,” reads the report. “While not all defects require immediate attention, the rise in these anomalies underscores an important takeaway from this year’s report: to optimize DC performance, more frequent data is needed on DC health in order to capture issues in a more timely manner as they arise.”
Robotics
Under such conditions, as the report points out, there is increasing interest among developers installing robotic inspections at solar sites, which Raptor Maps claims are achieving lower power losses and more efficient operations.
An analysis of 54 GW of solar sites using docked autonomous drones in 2025 – a 3.56× increase from the previous year – shows that these sites performed better, with an average power loss of 3% compared to 5.08% across the broader fleet.
With this technology, site inspections are now being done about 12 times more frequently than those without it, instead of the typical annual schedule, it points out.
Between 2024 and 2025, orders for advanced inspections, including checks of substations, wiring, inverter pads, and environmental conditions, rose by 3.94 times.
“Increased orders for advanced inspections in 2025 gave us more insight into the types, and magnitudes of risks solar farms face – trends that we are excited to check in on in subsequent years,” according to the report writers. “Specifically, this new data revealed that solar assets are consistently at risk of events – such as fires, substation anomalies, malfunctioning trackers, and erosion – that have the potential to lead to downtime and unplanned costs.”
For operations and maintenance (O&M) teams, automation is also improving workforce efficiency, it notes.
The findings suggest that asset owners are increasingly using robotics for more frequent monitoring to reduce risks, while operators are beginning to rely on these technologies to replace time-consuming preventive maintenance.
The complete report is available for free download on the Raptor Maps website.
