

China’s solar installations in 2026 are projected to drop between 24% to 43% from 2025 levels as the market adjusts after the shift from feed-in tariffs to market-based pricing, said CPIA
Worldwide solar installations are forecast at 500–667 GW in 2026, rising to nearly 900 GW by 2028 and up to 1 TW by 2030
China’s cumulative solar PV installations crossed 1.2 TW by end-2025, with about 80% added during the 14th FYP
Oversupply and price pressure marked 2024–2025, but exports grew in volume with wider market diversification beyond Europe
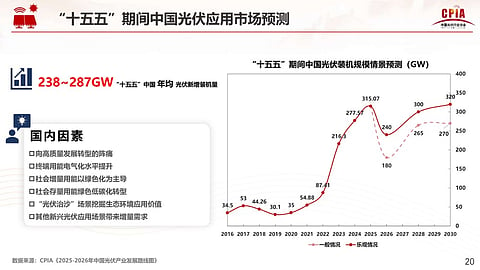
China, the world’s largest solar PV market, is expected to see its first drop in annual solar installations in 7 years in 2026, with the China Photovoltaic Industry Association (CPIA) estimating installations at 180 GW to 240 GW AC.
This will be 24% to 43% lower than the 315 GW AC installed in 2025, the year China switched from a feed-in-tariff (FIT) mechanism to a market-based pricing system (see China Sets New Annual Solar PV Installation Record In 2025).
After the expected dip this year, solar installations will pick up pace again from 2027, reaching between 265 GW and 300 GW AC in 2028 and between 270 GW and 320 GW AC in 2030.
The Chinese market will, in effect, impact global deployment figures, but other factors at work include an expected decline in US installations relative to previous forecasts due to policy uncertainty. On the other hand, other markets like India, the Middle East, North Africa, and Sub-Saharan Africa are likely to increase their annual deployments. The G20 Summit declaration supporting efforts to triple global renewable energy will also act as a positive lever.
Consequently, global solar installations will likely settle between 500 GW and 667 GW AC in 2026 (2025: 580 GW AC), before rising again and reaching 793 GW to 898 GW AC in 2028, and 881 GW to 1,044 GW AC in 2030, according to the CPIA’s forecast.
China’s cumulative solar PV installations at the end of 2025 exceeded 1.2 TW. CPIA says about 80% of this 1.2 TW was installed during China’s 14th Five-Year Plan (FYP) 2021-2025.
Reviewing the 14th FYP for China’s solar market at its annual conference, CPIA Consultant and Ex-Honorary Chairman Wang Bohua termed it the high-yield period for policy in the country when China introduced more than 250 PV-related policies. While dual-carbon goals and large-scale expansions backed by a favorable regulatory environment marked the ‘surge period’ from 2021 to 2023, the correction period (2024-2025) saw excessive expansion-led oversupply, price drops, and falling utilization rates. This pressured margins for companies as several reported net losses.
Nevertheless, China's solar export volume increased, whereas its value decreased between 2023 and 2024, as it did in 2024-2025. China’s solar cell exports nearly tripled from 5% at the end of the 13th FYP to 14.9% by the 14th FYP.
Chinese manufacturers produced solar products worth over RMB 1 trillion across the industry, excluding inverters, more than 4x the level in the previous FYP. Its total export value exceeded $180 billion, reaching $189.5 billion.
Export diversification in terms of markets was also a highlight, as the share of the top 10 markets declined from 72.6% in 2021 to below 50% in 2025. On the one hand, Bohua said export share to Asian and African markets improved, whereas exports to Europe declined to 39.2%.
As China moves to eliminate export tax rebates for solar, Bohua stressed that the market must move away from ‘involution’ or intense domestic competition toward high-quality, high-value global competition. Manufacturing focus must be on the 3 transitions, namely Intelligence, Greenification, and Integration.
“In terms of overseas layout, we must move beyond simple, extensive expansion and toward more strategic, flexible models. This includes aligning with national diplomatic strategies (Belt and Road, FOCAC), diversifying our business models, and adopting more varied operational approaches,” he added.
Technology
On the technology front, during the 14th FYP, China shifted to n-type monocrystalline that went from a single-digit market share in early 2021 to a projected 97% by 2025, while wafer thickness decreased by 12% to 27%. Tungsten wire diamond sawing now has over 90% share. Bohua noted that 182/210 mm large-size wafers now hold nearly 100% market share, while rectangular wafers account for a 70% share.
TOPCon firmly established itself as the mainstream technology with a share of 87.6%, while silver paste consumption for TOPCon dropped by more than 35% during the period.
A major highlight was the industry securing a comprehensive legal and regulatory framework, transitioning from target-driven growth.
“We have formed a closed-loop policy system covering everything from industrial upgrades to market applications—arguably the most complete in the world,” stressed Bohua.
China continues to account for over 80% of the global solar PV production capacity in all segments, even as manufacturing accelerates in the US, India, and the Middle East & North Africa. Overseas polysilicon production capacity continues to shrink as they struggle to compete with China’s cost and scale, noted Bohua.
At the end of the 14th FYP, China’s total production capacity had reached over 3.5 million tons of polysilicon, 1,500 GW of silicon wafers, 1,400 GW cells, and 1,100 GW modules. It rose from 460,000 tons of polysilicon, 240 GW of silicon wafers, 201 GW of solar cells, and 244 GW of modules as recorded at the end of the 13th FYP.
