

Solar and storage supplied 91% of all new US power generation capacity added in Q1 2026 despite a sharp decline in solar installations
Utility-scale solar remained the largest segment, while residential solar posted annual growth and record battery attachment rates
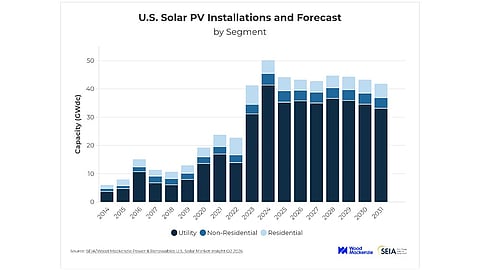
Analysts expect US solar additions to remain largely flat through 2031 as permitting delays, policy uncertainty and trade pressures offset strong project pipelines
The US solar PV market added 7.8 GW DC of new capacity in Q1 2026, marking a significant slowdown compared to previous periods. According to the U.S. Solar Market Insight 2026 Q2 Report, new installations were down 27% year-on-year (YoY) and 42% quarter-on-quarter (QoQ), owing to ongoing market challenges and typical seasonality.
Despite the decline, Solar Energy Industries Association (SEIA) and Wood Mackenzie found, solar and energy storage continued to dominate new power additions in the country. Together, the 2 technologies accounted for 91% of all new electricity generation capacity installed during the quarter, while solar alone accounted for 60% of all new capacity.
“In a world of fluctuating fuel prices, energy buyers have made it clear that they want the security, low cost, and speed of solar and storage, which commanded a massive 91% of all new capacity built in Q1,” said Darren Van’t Hof, SEIA Interim President and CEO.
While utility-scale solar segment installed the largest capacity during the quarter its 5.9 GW DC was down 34% YoY and 45% QoQ. Yet, analysts highlight that project execution remained strong as nearly all projects completed on schedule or came online 2-3 months ahead of plan. Contracting activity was strong as agreements were signed for 6.3 GW DC with a 15% annual increase. Most of this activity was seen in Texas led by data and technology companies. Contracts for utility-scale solar rose 15% YoY.
With 1.179 GW DC, residential solar marked one of the strongest quarters for this segment (excluding Q4 2025) as installations improved by 6% YoY but dropped 15% QoQ. Growth was supported by installations completed before the expiry of Section 25D tax credit, and delayed project interconnections. A record 45% of residential solar installations were paired with battery storage.
Despite the growth, the report writers project the residential solar segment in the US to contract by 21% in 2026 citing installer bankruptcies, limited tax equity availability, and permitting challenges. It returns to growth from 2027 supported by third party ownership (TPO) modules and project tax credit eligibility.
Commercial solar segment with its 523 MW DC was down 4% YoY and 25% QoQ, with strongest growth seen in California. Interconnection bottlenecks and permitting delays continue to act as bottlenecks, according to the report writers. They project growth to stabilize in 2027 before accelerating from 2028 onwards thanks to safe-harbored projects and rising retail electricity rates.
Community solar PV segment also declined 4% YoY and 67% QoQ with 247 MW DC installed. Most of the contraction was seen in New York. In 2026, the market is expected to grow by 1% reaching close to 1.7 GW DC. Near-term growth is driven by an 8.2 GW DC project pipeline.
While uncertainty remains around foreign entity rules and pending regulatory guidance, most utility-scale projects were safe-harbored before the new requirements took effect. At the same time, trade measures and tariffs continue to pressure the domestic solar manufacturing sector, which still depends heavily on imported solar cells.
As of June 2026, the US had 70 GW operational solar module production capacity with no new projects coming online in Q1, but there is 16 GW under construction. The country’s operational solar cell capacity, as per the SEIA and Wood Mackenzie, was 3.2 GW with 25 GW under construction.
As per the analysts, US solar capacity additions are expected to remain largely flat between 2026 and 2031, reflecting ongoing policy and structural challenges despite a strong project pipeline. More than 200 GW DC of safe-harbored solar capacity is expected to support near-term installations and sustain utility-scale growth through 2030.
In case the federal permitting slowdown continues along with lengthy equipment timelines, Wood Mackenzie Head of Solar Michelle Davis believes US solar additions will be flat over the next five years despite the need for more power supply in the US. The report projects average annual additions of 43 GW in the next 5 years at the same level as 2025 (see US Solar Deployments Dropped 14% YoY In 2025 With 43.2 GW DC Installed).
For the utility-scale segment, the report projects 211 GW DC additions between 2026 and 2031 with improved visibility into safe-harbored projects slightly improving forecast, particularly for 2028. “A total pipeline of 216 – 240 GWdc supports strong utility-scale buildout through 2030, even when accounting for attrition,” reads the report.
Project permitting remains a key challenge nevertheless. The Department of the Interior’s policy on solar and wind development is expected to affect around 30% of the early-stage solar pipeline (see Elevated US Federal Scrutiny For Wind & Solar Energy Projects).
In April 2026, a US judge temporarily blocked federal actions delaying solar and wind projects, but the SEIA counts 457 projects totaling 100 GW of solar and storage capacity at risk due to political attacks.
The complete report can be purchased from Wood Mackenzie’s website for $7,500.
