

The US installed 43.2 GW DC of new solar capacity in 2025, a 14% drop from the 50 GW record added in 2024, according to SEIA and Wood Mackenzie
Utility-scale segment saw the largest decline, with annual installations falling 16% as developers preferred to safe-harbor projects amid changes in tax credit deadlines
Residential installations fell slightly due to the early end of Section 25D tax credits; commercial solar grew by 6% but community solar declined by 25%
Despite policy uncertainties, analysts believe strong electricity demand and rising gas plant costs will keep solar competitive
The US market expanded by 43.2 GW DC of new solar PV capacity in 2025, emerging as the dominant power generation technology added to the grid for 5th year in a row. Yet it was a 14% year-on-year (YoY) drop as the industry navigated regulatory actions against clean energy and changing tax policies, according to the U.S. Solar Market Insight 2025 Year in Review report.
This compares to a record 50 GW DC the country installed in 2024, according to the Solar Energy Industries Association (SEIA) and Wood Mackenzie (see US Market Grew By Record 50 GW New Solar Capacity In 2024).
The decline was mostly seen in the utility-scale segment that shrank by nearly 40% quarter-on-quarter (QoQ) in Q4 with 34.7 GW DC added. On annual basis, this was 16% decrease as developers preferred to safe harbor their pipeline over commercial operations due to changes in tax credit deadlines.
Residential installations of 4.65 GW DC decreased by 2% annually mainly because of the early end to Section 25D tax credits. Commercial solar segment grew by 6% last year, adding 2.34 GW DC as NEM 2.0 installations continued to come online in California. Community solar, on the other hand, declined by 25% YoY installing 1.43 GW DC.
Moreover, Republican ruled states of Texas, Indiana, Florida, Arizona, Ohio, Utah and Arkansas together installed over 2/3rd of all solar capacity installed in 2025.
Altogether solar and energy storage represented 79% of all new capacity installed last year. According to the report, 70% of planned grid additions through 2030 are solar (45%) or storage (25%).
“Solar and storage continue to dominate new capacity additions to the grid despite policy headwinds. American households and businesses of all sizes are demanding solar + storage because they deliver fast, affordable power to help meet rapidly rising demand,” said SEIA Interim President and CEO Darren Van’t Hof.
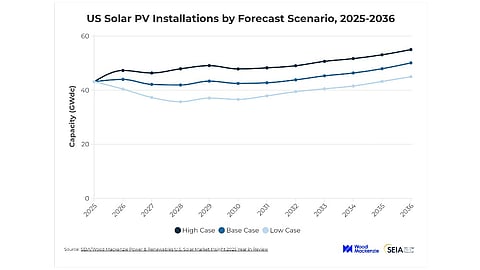
Report writers continue to be bullish regarding solar’s growth potential in the US citing quick deployment compared to other sources to meet surging electricity demand driven by data centers. The report pegs the country to add 490 GW of new solar capacity by 2036 which will expand the cumulative to nearly 770 GW DC in the base case scenario.
Head of Solar at Wood Mackenzie and Lead Author of the report Michelle Davis added, “Strong demand growth combined with escalating costs of new gas plants will allow solar to remain competitive, even without tax credits.”
It will need policy certainty though, especially with regard to the Foreign Entity of Concern (FEOC), trade actions related to Section 232 tariffs on polysilicon and its derivatives as well as the AD/CVD investigation into solar imports from Laos, Indonesia and India, federal permitting for utility-scale projects, and power demand growth, among other factors.
Recently, the Department of Commerce announced as high as over 143% preliminary subsidy rates for solar imports from Laos, Indonesia and India (see India, Indonesia, Laos Solar Imports Face High US CVD Rates). The government also released interim guidance for Prohibited Foreign Entity, but further guidance is awaited (see US Treasury Tightens Clean Energy Tax Credit Eligibility Under FEOC Guidance).
Van’t Hof however cautions, “Washington must deliver policy certainty for the market to work and to keep pace with growing energy demands. Without this certainty, less solar will get built and Americans will pay the price with higher energy bills.”
In terms of manufacturing, the year 2025 was “monumental” for the US as it expanded module capacity by over 50% YoY to bring online 65.5 GW, going up from 42.5 GW at the end of 2024. According to the SEIA Dashboard as of March 2026, the operational manufacturing capacity of the US across the supply chain had reached 66.6 GW for modules, 3.2 GW of cells, 5 GW of wafers, 5 GW of ingots, and 25 GW of polysilicon.
The complete report can be purchased from Wood Mackenzie’s website.
