- Module processing steps induces gain and loss mechanisms
- Cell-to-module (CTM) power ratio, a good metric to assess developments at module level, independent from cells, has exceeded 100% benchmark in 2021 according to latest ITRPV
- To analyze precisely the cell-to-module power ratios, Fraunhofer ISE has developed a software suite called SmartCalc.CTM, which is offered for free, while the institute launched a new 2.0 version called SmartCalc.Module with several updated features
Power and efficiency — the two performance characteristics of a module — are a function of collective efforts at the cell and module levels.
However, assessing module power improvements independent from the cell level is also possible. The so-called cell-to-module (CTM) power ratio, which is the ratio of module output power to the sum of each of the cells embedded in the module, is a good metric to assess developments and the stability of the entire module production process.
Several module processing steps, such as interconnection, stringing and lamination, lead to optical gains. But module manufacturing also induces various loss mechanisms, such as resistive, mismatch and optical losses, which offset the optical gains and result in a net power loss.
Optical losses are mainly due to reflection losses that occur at various interfaces of module layers — “air-glass — encapsulant — cell.” Undesired absorption of light from the front cover glass and EVA has a further compounding effect. Resistive losses are mainly contributed by the interconnection of cells and strings. Encapsulation gains are due to direct optical coupling as a result of higher refractive indices of the encapsulation layers. In addition, the light scattered from the cell gaps in the module and the metal contacts covered with ribbons also contribute to the positive side. Light scattered at an angle greater than the total internal reflection angle for the glass-air interface, which is about 42°, undergoes total internal reflection at the front glass-air interface and is redirected back to the solar cell, offering a second chance for absorption.
Fraunhofer ISE has developed a software suite called SmartCalc.CTM to analyze precisely the cell-to-module power losses. When fed with the bill of material (BOM) data of a module and the cell parameters, the software evaluates several attributes that contribute to the gains or losses of the final CTM. The research center is now offering SmartCalc.CTM for free; that means all the restrictions from the previous demo version have been lifted, and module designs, component specifications and material properties can now be accessed. Together with the release of the free version, Fraunhofer ISE has launched a new 2.0 version of the software called SmartCalc.Module with several updated features. In addition to the new user interface, the updated platform provides more components and module design options; for example, frames or cells with overlap are now part of the pack. Operating conditions such as ambient temperature and angle of incidence can also be customized. The new version comes with power tools such as sensitivity & bulk analysis.
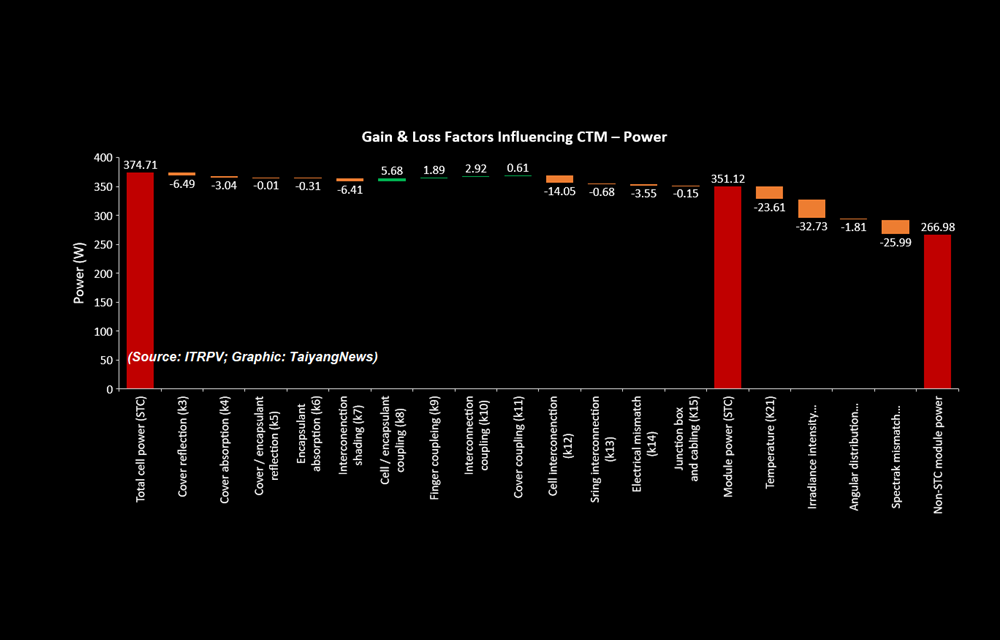
With details such as the BOM data, the cell parameters and module design aspects fed into it, the software evaluates 15 elements that contribute to the gains or losses of the final CTM and module setup. The SmartCalc website explains the functioning of the software by taking the example of a 60-cell bifacial glass-glass module at 900 W/m2 of light intensity on the front side, module temperature of 42°C and wind of 0 m/s.
The tool provides an analysis of both the important technical parameters of a module – power and efficiency. In the efficiency scenario, a module built with 22.78% efficiency cells results in a module efficiency of 18.87% measured at STC and 15.95% in simulated operational conditions as specified above. Here, the factors that account for losses are module margin, cell spacing, absorption and reflection from the cover glass as well as the encapsulant, interconnection shading, cell interconnection, stringing interconnection, electrical mismatch, junction box and cabling. The coupling gains from the cell or encapsulant, fingers, and rear cover contribute to the gain.
The scenario changes slightly when analyzing the power loss, which is not influenced by the module margins and cell spacing. Going with the same example, the sum power of 60 cells in the module amounts to 374.71 W, while the final module built with such cells would have an output power of only 351.12 W at STC and the power rating is expected to drop further to 266.98 in simulated operating conditions. However, the scenarios of the example described here have to be taken just as a reference as CTM losses vary significantly from one technology to the other, as well as the BOM.
The SmartCalc.Module software covers a wide variety of module designs based on dimensions, solar cell technologies including bifacial function, metallization layouts of cells, interconnection technologies, and BOM.
Despite the dominating role of various loss mechanisms, today’s PV modules have the capability to reach a CTM power gain of more than 100%. In simple terms, this can be achieved with the proper choice and mix of complementing materials that result in higher optical gains than combined optical and electrical losses. In parallel, advanced interconnection helps in reducing the resistance losses, pushing CTM power ratios further up. The half-cell approach is one good example here.
The 13th edition of the ITRPV roadmap compares the CTM ratio of 1/3rd cell, half cell and full cell, through the full cell modules is obsolete these days, especially since the advent of the larger wafer formats. According to the roadmap, CTM ratio has already reached a 101% level with 3-cut cell and above 100.5 for half cell configuration in 202. Bothe the configurations are expected to reach 101.5% and 101% by 2024. It would take next 8 years take gain about 1% gain in CTM; the 3-cut cell configuration is expected to reach 102.5% and close to 102% for half cell by 2032
The Text is an excerpt from TaiyangNews’ recent solar module innovations report 2022, which can be downloaded for free here.


